20th Livestock Census

The livestock census in the country started in the year 1919-1920. Since then it has been conducted once in every 5 years. So far 20th Livestock Censuses had been conducted and the last census was held in the year 2018. The 20th Livestock Census was launched during the month of October, 2018. The enumeration was done in both rural and urban areas. Various species of animals (cattle, buffalo, mithun, yak, sheep, goat, pig, horse, pony, mule, donkey, camel, dog, rabbit and elephant)/poultry birds (fowl, duck and other poultry birds) possessed by the households, household enterprises/non-household enterprises were counted at that site. Another important feature of 20th Livestock Census is it has been designed to capture Breed-wise number of animals and poultry birds.
| Category | Population (In million) 2012 | Population (In million) 2019 | % growth |
| Cattle | 190.90 | 192.49 | 0.83 |
| Buffalo | 108.70 | 109.85 | 1.06 |
| Sheep | 65.07 | 74.26 | 14.13 |
| Goat | 135.17 | 148.88 | 10.14 |
| Pig | 10.29 | 9.06 | -12.03 |
| Mithun | 0.30 | 0.38 | 26.66 |
| Yak | 0.08 | 0.06 | -25.00 |
| Horses & Ponies | 0.63 | 0.34 | -45.58 |
| Mule | 0.20 | 0.08 | -57.09 |
| Donkey | 0.32 | 0.12 | –61.23 |
| Camel | 0.40 | 0.25 | -37.05 |
| Total Livestock | 512.06 | 535.78 | 4.63 |
| Total Poultry | 729.21 | 851.81 | 16.81 |
| ALL INDIA LIVESTOCK CENSUS 2019 | |
| Cattle | 19.24 Crore |
| Buffalo | 10.98 Crore |
| Sheep | 7.42 Crore |
| Goat | 14.88 Crore |
| Total Bovine | 30.27 Crore |
| Yaks | 60 thousand |
| Mithuns | 3.80 lakh |
| Horses & Ponies | 3.40 lakh |
| Mules | 80 thousand |
| Donkey | 1.20 lakh |
| Camels | 2.50 lakh |
| Pigs | 90.60 Lakh |
| Total Livestock | 53.57 Crore |
| Total Poultry | 85.18 Crore |
Distribution of Livestock Population
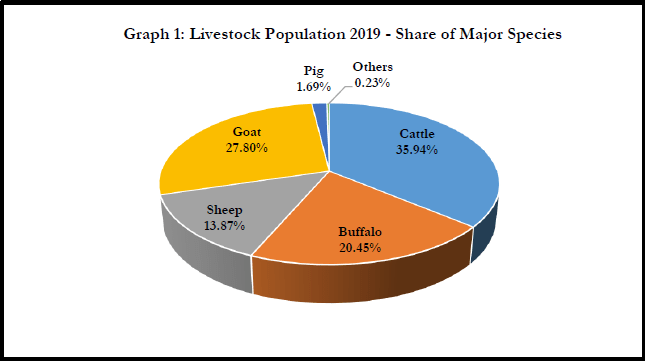
| Cattle | 35.94% |
| Buffalo | 20.45% |
| Sheep | 13.87% |
| Goat | 27.80% |
| Pig | 1.69% |
| Other | 0.23% |
| Total | 100% |
Livestock Population, 2012 & 2019 of Major States
| States | Population (In million) 2012 | Population (In million) 2019 | % Change | |
| 1 | Uttar Pradesh | 68.7 | 67.8 | -1.35 |
| 2 | Rajasthan | 57.7 | 56.8 | -1.66 |
| 3 | Madhya Pradesh | 36.3 | 40.6 | 11.81 |
| 4 | West Bengal | 30.3 | 37.4 | 23.32 |
| 5 | Bihar | 32.9 | 36.5 | 10.67 |
| 6 | Andhra Pradesh | 29.4 | 34.0 | 15.79 |
| 7 | Maharashtra | 32.5 | 33.0 | 1.61 |
| 8 | Telangana | 26.7 | 32.6 | 22.21 |
| 9 | Karnataka | 27.7 | 29.0 | 4.70 |
| 10 | Gujarat | 27.1 | 26.9 | -0.95 |
Poultry Population
| Population (In million) 2012 | Population (In million) 2019 | % growth | |
| Backyard poultry | 217.49 | 317.07 | 45.78 |
| Commercial Poultry | 511.72 | 534.74 | 4.50 |
| Total Poultry | 729.21 | 851.81 | 16.81 |
Poultry Population, 2012 & 2019 of Major States
| States | Population (In million) 2012 | Population (In million) 2019 | % Change | |
| 1 | Tamil Nadu | 117.3 | 120.8 | 2.92 |
| 2 | Andhra Pradesh | 80.6 | 107.9 | 33.85 |
| 3 | Telangana | 80.8 | 80.0 | -0.93 |
| 4 | West Bengal | 52.8 | 77.3 | 46.34 |
| 5 | Maharashtra | 77.8 | 74.3 | -4.49 |
| 6 | Karnataka | 53.4 | 59.5 | 11.33 |
| 7 | Assam | 27.2 | 46.7 | 71.63 |
| 8 | Haryana | 42.8 | 46.3 | 8.11 |
| 9 | Kerala | 24.3 | 29.8 | 22.61 |
| 10 | Odisha | 19.9 | 27.4 | 37.95 |
Cattle Population, 2012 & 2019 in Major States
| States | Population (In million) 2012 | Population (In million) 2019 | % Change | |
| 1 | West Bengal | 16.5 | 19.0 | 15.18 |
| 2 | Uttar Pradesh | 19.6 | 18.8 | -3.93 |
| 3 | Madhya Pradesh | 19.6 | 18.7 | -4.42 |
| 4 | Bihar | 12.2 | 15.3 | 25.18 |
| 5 | Maharashtra | 15.5 | 13.9 | -10.07 |
| 6 | Rajasthan | 13.3 | 13.9 | 4.41 |
| 7 | Jharkhand | 8.7 | 11.2 | 28.16 |
| 8 | Assam | 10.3 | 10.9 | 5.29 |
| 9 | Chhattisgarh | 9.8 | 10.0 | 1.63 |
| 10 | Odisha | 11.6 | 9.9 | -15.01 |
Buffalo Population 2012 & 2019 of Major States
| States | Population (In million) 2012 | Population (In million) 2019 | % Change | |
| 1 | Uttar Pradesh | 30.6 | 33.0 | 7.81 |
| 2 | Rajasthan | 13.0 | 13.7 | 5.53 |
| 3 | Gujarat | 10.4 | 10.5 | 1.52 |
| 4 | Madhya Pradesh | 8.2 | 10.3 | 25.88 |
| 5 | Bihar | 7.6 | 7.7 | 2.02 |
| 6 | Andhra Pradesh | 6.5 | 6.2 | -3.76 |
| 7 | Maharashtra | 5.6 | 5.6 | 0.17 |
| 8 | Haryana | 6.1 | 4.4 | -28.22 |
| 9 | Telangana | 4.2 | 4.2 | 1.59 |
| 10 | Punjab | 5.2 | 4.0 | -22.17 |
Sheep Population 2012 & 2019 of Major States
| States/UTs | Population (In million) 2012 | Population (In million) 2019 | % Change | |
| 1 | Telangana | 12.8 | 19.1 | 48.51 |
| 2 | Andhra Pradesh | 13.6 | 17.6 | 30.00 |
| 3 | Karnataka | 9.6 | 11.1 | 15.31 |
| 4 | Rajasthan | 9.1 | 7.9 | -12.95 |
| 5 | Tamil Nadu | 4.8 | 4.5 | -5.98 |
| 6 | Jammu & Kashmir | 3.4 | 3.2 | -4.19 |
| 7 | Maharashtra | 2.6 | 2.7 | 3.87 |
| 8 | Gujarat | 1.7 | 1.8 | 4.66 |
| 9 | Odisha | 1.6 | 1.3 | -19.10 |
| 10 | Uttar Pradesh | 1.4 | 1.0 | -27.25 |
Goat Population 2012 & 2019 of Major States
| States | Population (In million) 2012 | (In million) 2019 | % Change | |
| 1 | Rajasthan | 21.67 | 20.84 | -3.81 |
| 2 | West Bengal | 11.51 | 16.28 | 41.49 |
| 3 | Uttar Pradesh | 15.59 | 14.48 | -7.09 |
| 4 | Bihar | 12.15 | 12.82 | 5.49 |
| 5 | Madhya Pradesh | 8.01 | 11.06 | 38.07 |
| 6 | Maharashtra | 8.44 | 10.60 | 25.72 |
| 7 | Tamil Nadu | 8.14 | 9.89 | 21.43 |
| 8 | Jharkhand | 6.58 | 9.12 | 38.59 |
| 9 | Odisha | 6.51 | 6.39 | -1.84 |
| 10 | Karnataka | 4.80 | 6.17 | 28.63 |
Pig Population 2012 & 2019 of Major States
| States | Population (In million) 2012 | Population (In million) 2019 | % Change | |
| 1 | Assam | 1.64 | 2.10 | 28.30 |
| 2 | Jharkhand | 0.96 | 1.28 | 32.69 |
| 3 | Meghalaya | 0.54 | 0.71 | 29.99 |
| 4 | West Bengal | 0.65 | 0.54 | -16.63 |
| 5 | Chhattisgarh | 0.44 | 0.53 | 20.01 |
| 6 | Uttar Pradesh | 1.33 | 0.41 | -69.37 |
| 7 | Nagaland | 0.50 | 0.40 | -19.65 |
| 8 | Bihar | 0.65 | 0.34 | -47.14 |
| 9 | Karnataka | 0.30 | 0.32 | 6.25 |
| 10 | Mizoram | 0.25 | 0.29 | 19.26 |
Camel Population 2012 & 2019 of Major States
| States | Population (In lakhs) 2012 | Population (In lakhs) 2019 | % Change | |
| 1 | Rajasthan | 3.26 | 2.13 | -34.69 |
| 2 | Gujarat | 0.30 | 0.28 | -9.19 |
| 3 | Haryana | 0.19 | 0.05 | -72.65 |
| 4 | Uttar Pradesh | 0.08 | 0.02 | -69.45 |
Horses & Ponies Population 2012 & 2019 of Major States
| States | Population (In Lakhs) 2012 | Population (In Lakhs) 2019 | % Change | |
| 1 | Uttar Pradesh | 1.52 | 0.76 | -50.14 |
| 2 | Jammu & Kashmir | 1.44 | 0.63 | -56.17 |
| 3 | Rajasthan | 0.38 | 0.34 | -10.85 |
| 4 | Bihar | 0.49 | 0.32 | -34.13 |
| 5 | Gujarat | 0.18 | 0.22 | 19.42 |
| 6 | Maharashtra | 0.37 | 0.19 | -49.33 |
| 7 | Punjab | 0.33 | 0.14 | -56.66 |
| 8 | Madhya Pradesh | 0.19 | 0.13 | -29.48 |
| 9 | Assam | 0.14 | 0.13 | -9.68 |
| 10 | Haryana | 0.37 | 0.10 | -73.58 |
Mules Population 2012 & 2019 of Major States
| States | Population (In Lakhs) 2012 | Population (In Lakhs) 2019 | % Change | |
| 1 | Uttarakhand | 0.27 | 0.26 | -2.25 |
| 2 | Himachal Pradesh | 0.23 | 0.20 | -12.44 |
| 3 | Jammu & Kashmir | 0.37 | 0.17 | -54.20 |
| 4 | Uttar Pradesh | 0.43 | 0.09 | -79.06 |
| 5 | Madhya Pradesh | 0.07 | 0.03 | -63.61 |
Donkey Population 2012 & 2019 of Major States
| States | Population (In Lakhs) 2012 | Population (In Lakhs) 2019 | % Change | |
| 1 | Rajasthan | 0.81 | 0.23 | -71.31 |
| 2 | Maharashtra | 0.29 | 0.18 | -39.69 |
| 3 | Uttar Pradesh | 0.57 | 0.16 | -71.72 |
| 4 | Gujarat | 0.39 | 0.11 | -70.94 |
| 5 | Bihar | 0.21 | 0.11 | -47.31 |
| 6 | Jammu & Kashmir | 0.17 | 0.10 | -44.55 |
| 7 | Karnataka | 0.16 | 0.09 | -46.11 |
| 8 | Madhya Pradesh | 0.15 | 0.08 | -45.46 |
| 9 | Himachal Pradesh | 0.07 | 0.05 | -34.73 |
| 10 | Andhra Pradesh | 0.10 | 0.05 | -53.22 |
Mithun Population 2012 & 2019 of Major States
| States | Population (In numbers) 2012 | Population (In numbers) 2019 | % Change | |
| 1 | Arunachal Pradesh | 249000 | 350154 | 40.62 |
| 2 | Nagaland | 34871 | 23123 | -33.69 |
| 3 | Manipur | 10131 | 9059 | -10.58 |
| 4 | Mizoram | 3287 | 3957 | 20.38 |
Yak Population 2012 & 2019 of Major States
| States | Population (In Numbers) 2012 | Population (In Numbers) 2019 | % Change | |
| 1 | Jammu & Kashmir | 54493 | 26221 | -51.88 |
| 2 | Arunachal Pradesh | 14061 | 24075 | 71.22 |
| 3 | Sikkim | 4036 | 5219 | 29.31 |
| 4 | Himachal Pradesh | 2921 | 1940 | -33.58 |
| 5 | West Bengal | 1089 | 213 | -80.44 |
| Category | Population (In million) 2012 | Population (In million) 2019 | % Change |
| Cow | |||
| Exotic/Crossbred | |||
| Male | 5.97 | 3.46 | -42.0 |
| Female | 33.76 | 46.95 | 39.1 |
| Total Exotic/Crossbred | 39.73 | 50.42 | 26.9 |
| Indigenous/Non-Descript | |||
| Male | 61.95 | 43.94 | -29.1 |
| Female | 89.22 | 98.17 | 10.0 |
| Total Indigenous/Non-Descript | 151.17 | 142.11 | -6.0 |
| Total Cattle | 190.90 | 192.49 | 0.8 |
| Buffalo | |||
| Total Male | 16.10 | 9.28 | -42.35 |
| Total Female | 92.60 | 100.57 | 8.61 |
| In-milk | 36.57 | 38.16 | 4.34 |
| Dry | 14.48 | 13.01 | -10.19 |
| Milch animals (In Milk + Dry) | 51.05 | 51.17 | 0.22 |
| Buffaloes-Total | 108.70 | 109.85 | 1.06 |
| Sheep | |||
| Exotic/Crossbred | 3.78 | 4.09 | 8.12 |
| Exotic/ Crossbred Male | 1.21 | 0.83 | -31.32 |
| Exotic/ Crossbred Female | 2.57 | 3.26 | 26.85 |
| Indigenous/Non-Descript | 61.29 | 70.17 | 14.50 |
| Indigenous/ Non-Descript Male | 13.92 | 12.53 | -9.94 |
| Indigenous/ Non-Descript Female | 47.37 | 57.64 | 21.67 |
| Sheep – Total | 65.07 | 74.26 | 14.13 |
| Goat | |||
| Male | 37.62 | 32.10 | -14.65 |
| Female | 97.56 | 116.78 | 19.71 |
| In-milk | 36.25 | 41.83 | 15.38 |
| Dry | 25.31 | 27.82 | 9.95 |
| Milch animals (In Milk + Dry) | 61.56 | 69.65 | 13.15 |
| Goat-Total | 135.17 | 148.88 | 10.14 |
| Pig | |||
| Exotic/Crossbred | 2.46 | 1.90 | -22.76 |
| Indigenous/Non-Descript | 7.84 | 7.16 | -8.66 |
| Pig-Total | 10.29 | 9.06 | -12.03 |
| Camel | |||
| Male | 0.19 | 0.08 | -56.40 |
| Female | 0.21 | 0.17 | -19.46 |
| Camel-Total | 0.40 | 0.25 | -37.05 |
|
Donkey, Mules and Horses & Ponies |
|||
| Category | Population (In million) 2012 | Population (In million) 2019 | % Change |
| Horses & Ponies-Total | 0.62 | 0.34 | -45.58 |
| Mules-Total | 0.20 | 0.08 | -57.09 |
| Donkey-Total | 0.32 | 0.12 | -61.23 |
| Total | 1.14 | 0.54 | -52.63 |
| Mithun | |||
| Category | Population (In Lakh) 2012 | Population (In Lakh) 2019 | % Change |
| Male | 1.3 | 1.7 | 30.76 |
| Female | 1.7 | 2.1 | 23.52 |
| Mithun-Total | 3.0 | 3.8 | 26.66 |
| Yak | |||
| Category | Population (In 000) 2012 | Population (In 000) 2019 | % Change |
| Male | 35 | 26 | -25.71 |
| Female | 42 | 32 | -23.80 |
| Yak-Total | 77 | 58 | -24.67 |
| More Important Points | Click |
| Download Full Census Pdf | Click |
Thanks & superb
Thanks for provide current material
& plz provide nabard based subsidy
Superb… Very useful
Helpful